From data to intelligence: Using key performance indicators to gain a strategic advantage
- Written By Robert Lasher

The good news is that more data is available in more places than ever before, and one important key to achieving profitable growth, differentiation, and a unique market position is the ability to turn data into meaningful information and then make that information widely available inside and outside the company. The diagram below illustrates the measures involved in creating information visibility throughout a company and its business processes.
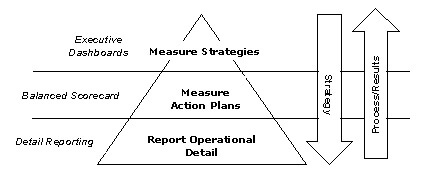
Information Visibility
Perspectives and scorecards
Most insurance industry executives are keenly aware of the key performance indicators (KPIs) used to measure their company’s progress against goals. Experience in working with growth companies in the property and casualty (P&C) industry has taught us the value of tracking KPIs effectively by converting raw data into useful information from which informed decisions – both strategic and tactical – can be made.
KPIs can be grouped by areas of responsibility (perspectives), and by specific areas of common interest (scorecards). At the highest level, KPIs can be categorized according to perspectives such as underwriting, claims, marketing, and finance, with the understanding that there is significant overlap and interdependence among those areas of responsibility. The level of detail at which performance should be monitored is likely to vary based on management level, with executives benefiting from a broader view and line managers examining more granular detail.
Profit-related KPIs
KPIs that measure profit performance include:
- Return on surplus
- Loss ratio
- Premiums per exposure
- Losses per exposure
- Frequency per exposure
- Severity
- Components of claim costs
- Timing of closed claims
The key performance measurement of severity – the average cost of a claim measured over time – is affected by controlling (i) components of claim costs – the costs involved with significant controllable elements of claims, such as legal costs, and (ii) the timing of closed claims – a measure of the number of days to close each type of claim.
Frequency is a measure of the number of claims that are expected based on exposure. For workers’ compensation, the exposure base is measured in payroll dollars. Frequency multiplied by severity yields loss per exposure. Comparing loss per exposure to premium per exposure yields the amount of gross profit produced before consideration of expenses. This relationship is most commonly reported in terms of the loss ratio. Combining the loss ratio with expense and investment income produces a picture of the total profit for the business – a profit best expressed as return on surplus. This KPI monitors a company’s use of capital and the extent to which it achieves target rates of return on business investment.
Incurred vs. reported/policy year vs. accident year
It is useful to measure profit performance on both reported and incurred bases, as well as on accident year and policy year bases to supplement the five profit-related categories, which include:
- Loss ratio
- Premiums per exposure
- Losses per exposure
- Frequency per exposure
- Severity
Reported results represent actual paid and reported data to date, but that is a difficult basis to use for management because it is undeveloped information. The addition of development factors converts reported data to incurred data, which provides an income statement perspective on an accident year basis. This involves the use of actuarial estimated development factors to convert reported statistics into incurred statistics.
In addition, accident year is point-in-time information, whereas policy year is a better indication of expected future results. More importantly, pricing decisions are made on a policy year basis and an ability to validate pricing expectations through policy year actual results is especially valuable. The availability of all four (incurred, reported, accident year and policy year) when combined on one scorecard for each KPI category provides additional insights regarding the consistency or quality of results.
Production-related KPIs
The five traditional KPIs that measure production performance include:
- Premium vs. budget
- Renewal retention
- Sales or new business
- New business strike rate
- Quoted business vs. production targets
Production performance measurement is a combination of (i) renewal retention, which is the amount of business that stays on the books after renewal and (ii) new business production. New business production performance is evaluated by quoted business vs. production targets and strike rates. Strike rates are measures of the quality of new business that agents or brokerages are bringing to the company and reflect the underwriting acceptance rate.
Dimensions
Dimensionality selections are of interest across most or all KPIs and are limited only by the availability of data. Some common dimensionality selections are listed in the table below.
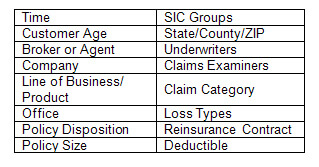
Dimensionality selections (examples)
Dimensions can either be company-focused, spanning various lines of business such as those listed in the table above, or specific to a single line of business like those listed in the table below. Analyzing at both the company and the line of business level helps to pinpoint the most profitable opportunities and the biggest risks.
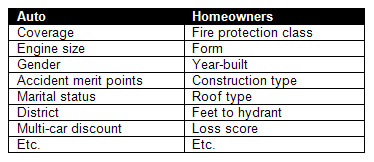
Single line of business dimensions
The value of a scorecard is greatly enhanced by the number of dimensions utilized and the extent that those dimensions can be spread across different KPIs.
Trended KPIs
The ability to examine KPIs over time is particularly important. Individual biases can influence the interpretation of data anomalies at point in time in a way that misrepresents the actual situation. Trended results back up the validity of point-in-time interpretations. This capability is especially important in the insurance industry where the results of decisions can take several years to be fully realized and, conversely, where expected shifts in trends can begin to develop and become evident more quickly.
Component costs and timing of claims settlement
The analysis of component costs and the timing of the settlement of claims provides the controlling performance measurements to keep those average claim costs within their expected range. Understanding legal costs, for example, is important in controlling the claims settlement process. Further, many insurers monitor the ratio of litigated to non-litigated claims.
The timing of settling claims is measured in terms of the average number of days for which all claims are open. A more common analysis is based on closed claim statistics. An important distinction for workers’ compensation lines is the breakdown in loss types between medical claims versus indemnity claims, because settlement periods are very different – the average closed claim settlement period is about ninety days for a medical claim and one year for an indemnity claim.
Significant value can be realized in claim cost savings by decreasing the time for settling a claim or decreasing the component cost of a claim. These Key Performance Indicators provide the tools with which to monitor and bring about those improvements.
Additionally, these improvements can be achieved by pushing performance measures down to the examiner level and summarizing for examiners’ work loads to provide feedback to examiners and their supervisors. The information can also be summarized at the supervisor or executive level for measuring enterprise performance.
Severity
Severity is a measure of the change in average cost per claim over time. Generally speaking, normal changes in severity, such as those due to inflation, will be offset by changes in product pricing. Examining dimensionality in severity is useful where cost trends vary dramatically. For example, in workers’ compensation, medical cost trends are increasing by an average of 10% per year while the cost trend for lost time indemnity claims is nearly flat.
Frequency
Frequency is a measure of the quality of business. To state the obvious, expect riskier business to have more accidents per unit of measure, and less risky business to have a lower accident count for the same unit of measure.
Expected levels of frequency are reflected in prices. Variances in frequency from expected levels may reflect a need to reinforce underwriting guidelines, examine the performance of the underwriters, change underwriting guidelines or change pricing.
A level frequency over time is expected for most insurance products. In workers’ compensation, because safety in the work place has been improving, the industry trend for frequency has been a continuing decline over the last ten years or so.
Further, many insurers are working with customers to help develop safety programs that reduce their frequency of loss and reduce their premiums accordingly; a “win-win” for both carrier and customer.
Dimensionality is used to examine actual results compared to expected changes in frequency. For example, if a carrier is successful in helping its customers reduce their frequency of loss, it should see a declining frequency with customer age. Similarly, as a carrier looks at class codes within hazard groups, it should see a higher frequency of loss within higher hazard groups and a lower frequency within lower groups.
Profit per exposure
Profit per exposure combines loss costs and premiums per exposure, looking at accident year and policy year profits. Because these are profitability measures, profit per exposure is looked at only on a fully developed, incurred (rather than reported) basis. Reported or undeveloped figures often provide a misleading view of profitability.
The calculation of profit is viewed both for the accident year and policy year. This information is very powerful in bringing together the combined cost and pricing trends to determine whether or not profit levels are being maintained.
Loss ratio
Loss ratio is a universally acknowledged measure of profitability across all dimensions. Loss ratio is measured both on an incurred and reported basis and for accident and policy years. The opportunity is presented here to carry that loss ratio into virtually every dimension and every broker allowing brokers to delve further into the detail of their individual accounts in order to analyze profitability trends. If issues that adversely impact profitability are identified, the other KPIs provide opportunities to explore further whether those issues are matters of frequency, severity, or pricing trends.
Retention
Retention is a measure of renewal business performance. This can be viewed on a gross (i.e., all accounts that are remaining after renewal) or net basis. Using a net basis is far more common; it excludes cancellations, so a net retention metric measures only the retention of desirable customers.
Dimensionality allows managers to evaluate retention of business in depth. For example, if an insurer is good at retaining older customers (using “age” as a dimension), are they targeting the most profitable demographic given their basket of products?
Strike rates
Strike rates reflect the effectiveness of new business production efforts. They can be examined across five key metrics: percentage bound, percentage pending, percentage declined, percentage lost and percentage closed. Collectively, these metrics add up to one hundred percent of the business.
Percentage declined represents the percentage of business rejected from the broker – a good indication of the quality of business that brokers or agents are providing. Percentage closed represents business that was actually written. If a target strike rate for closed business is established, using dimensionality to evaluate strike rates by broker is a particularly powerful measure of their performance.
Premium budget
Premium uses detail budgets and quickly evaluates the roll-up impact of variances. Its power rests in the degree of dimensionality with which goals are established. For example, goals may be set by broker, office, policy size, class codes, or hazard groups; all of which help to evaluate whether or not the company is achieving a product risk profile that matches its strategy.
Return on surplus
The summary scorecard metric that reflects the total performance of all previous metrics is return on surplus. This metric monitors the performance of the company’s investment in markets based on its strategic risk profile by state, class code and office. It provides a very powerful tool to evaluate and make decisions on “best use of capital” opportunities – for example, determining whether or not to invest to support new market opportunities based on the combination of lines of business that may or may not produce the firm’s target level of return on surplus. Similarly, it provides an easy means to analyze the tradeoff of increasing capital with surplus notes, reinsurance, or other forms of risk protection by measuring the expected increased return on surplus to the organization versus the anticipated cost of additional capital.
Building the framework
Measuring KPIs is certainly not a new concept in the insurance industry. However (and remarkably), the ability to display and distribute KPI data companywide is. Companies need access to detail data in a measurement framework that is organized around business success criteria. They need to be able to see a comprehensive picture of the entire business all at once, and not be limited to snapshots of each functional area that must then be pieced together, typically in an Excel spreadsheet. Managers need an analytical capability that supports end user questions at every level and a common perspective that ties it back to a business level.
Business intelligence (BI) and reporting tools currently offer much of the functionality needed for this kind of analysis. One challenge, however, is collecting and loading the data from the various operations systems into a central repository so that BI tools can be used most effectively. Another challenge is building the BI framework and doing the computations necessary to make the data relevant. A third hurdle is getting data into a useful format.
Business users need a self-service environment where they can quickly get to the data they need. While many companies have constructed data warehouses for specific application (e.g., actuarial data analysis), they have yet to address the higher-level requirements of executives and other management-related business users.
BI reporting tools come in suites, though there is no “silver bullet” reporting tool that can do all things for all people. Regardless of where companies lie in the BI maturity model (see chart on the following page), deriving real business value takes a lot of time and significant investment. Further, once a company decides to extend their BI capabilities beyond a specific application reporting area, a data warehouse or data mart that aggregates data across the organization may be need to be deployed – a non-trivial feat – but well worth the extra effort.
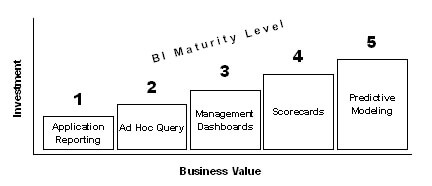
Business intelligence maturity levels
Solution options
Until recently, the only option a company had for timely and comprehensive management reporting was to build its own reporting solution from scratch. Excel was (and still is) probably the most widely used method for reporting and analysis. Today, the volume of data and the need for a standard set of measures, multiple types of analysis and the burdens of new regulations have driven organizations toward more robust solutions.
We advise companies that want to “build” their own solution to select the best BI software they can find, determine what they need to measure, aggregate the necessary data, and then craft a solution that can satisfy changing business demands over the long haul. Companies can also choose to “buy” a solution rather than building one, and solutions are available that are built specifically for P&C companies. Packaged solutions provide a defined set of KPIs out of the box, and have the advantage of faster implementation. Packaged P&C industry “on-demand” or “Software as a Service” (SaaS) solutions are also available that have the ability to manage the entire process and deliver user-defined KPIs via the web.
Summary
The demands of the marketplace are causing savvy insurers to take a closer look at the best way to tap into the many business insights contained in their data. Defining and monitoring KPIs helps companies to measure profit, production and underwriting performance. A company can only control what it measures, and monitoring the correlation between underwriting and claims will support decisions that impact the conduct of business processes.
Process improvements may be enabled by new technologies, but telltale improvements come from measuring outcomes and tracking performance. Measurement is what separates managing from improving, and improving is how an organization wins.
Bob Lasher is president and CEO of iPartners. Bob possesses more than 25 years of software industry experience and is responsible for the overall strategy and vision for the company. iPartners is a successful spin-off of Application Partners, a leading consultancy in Enterprise Performance Management founded in 1994. Bob has developed a team with vast experience in helping organizations improve their operating performance. iPartners’ flagship offering, the Insurance Scorecard, provides insurers with a turnkey performance management solution. The Scorecard is focused on serving the business needs of mid-sized P&C insurers and is currently deployed among some 600 insurance professionals at 19 individual client companies. Bob is a graduate of Clemson University, and holds a B.S. in Administrative Management.